Understand your energy.
Control your costs.

Understand your energy.
Control your costs.

Understand your energy.
Control your costs.

Your smart meter measures your energy, Tewke helps your whole family understand it. Tewke brings together live energy data, electricity tariffs and smart automations, making it simple for everyone to use energy more intelligently.

Your smart meter measures your energy, Tewke helps your whole family understand it. Tewke brings together live energy data, electricity tariffs and smart automations, making it simple for everyone to use energy more intelligently.

  • Energy tariff data

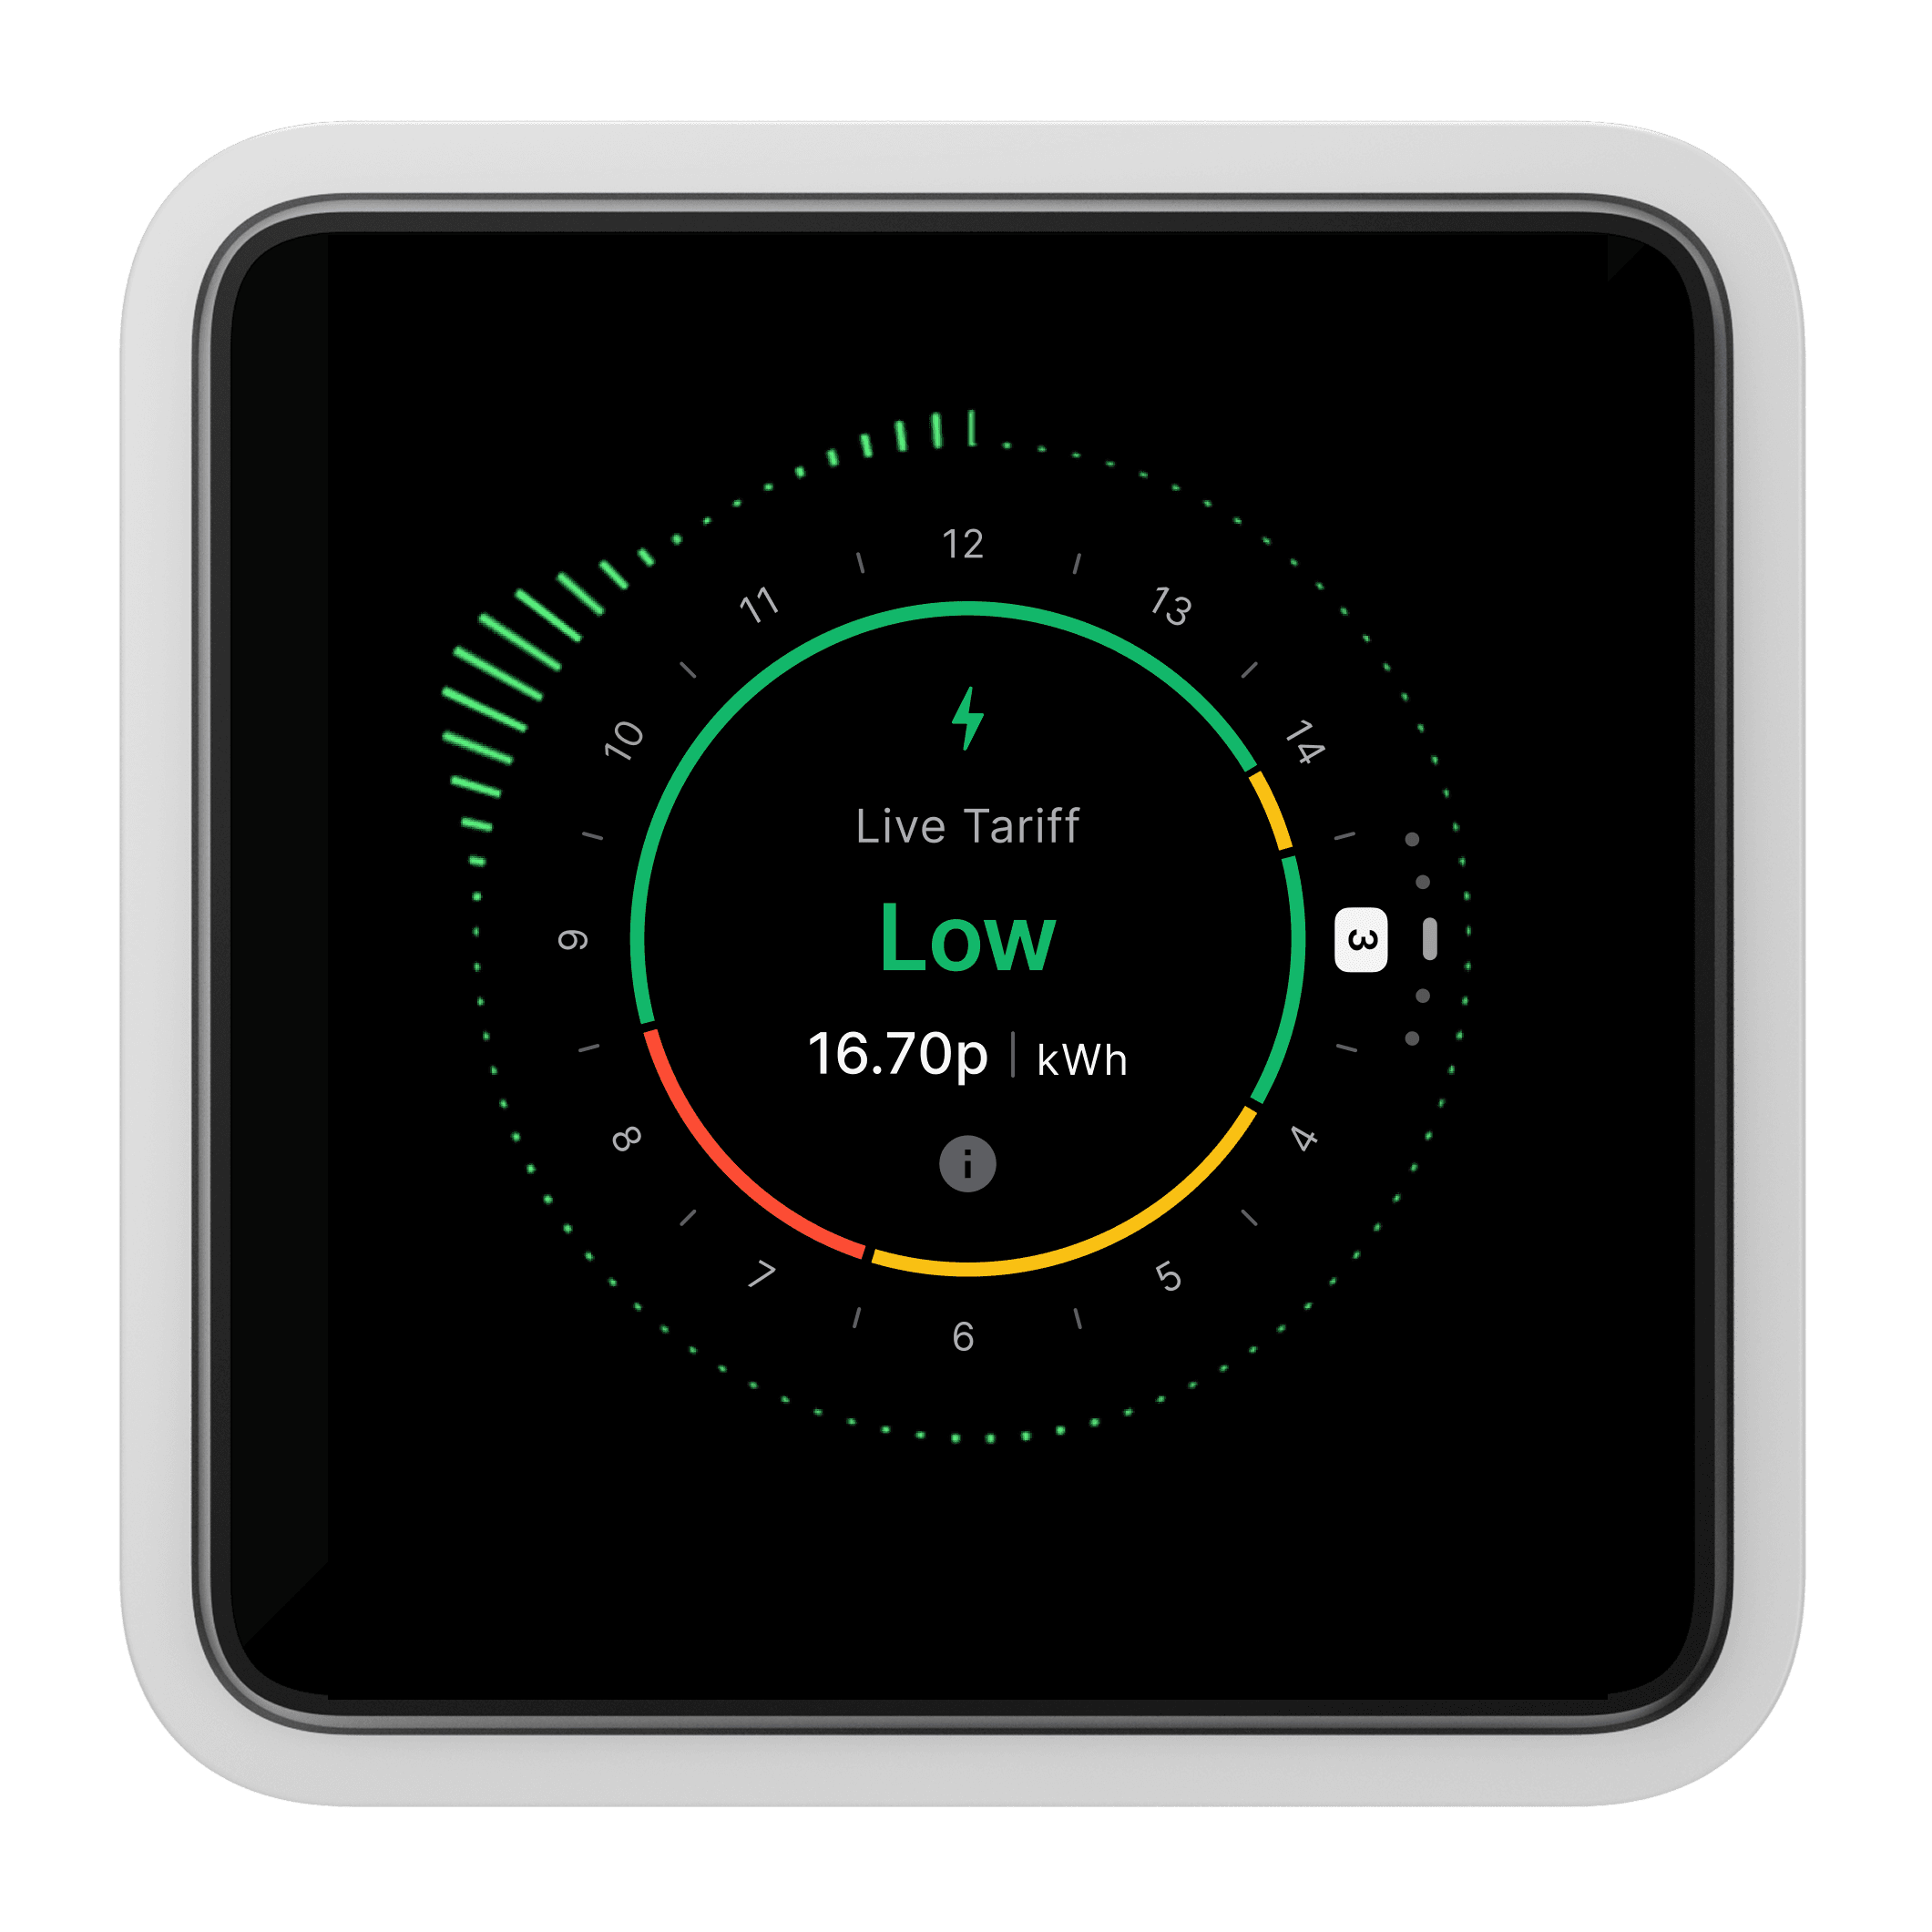
    Your electricity costs, at a glance.
    View your live energy rate directly on Tap’s clock and understand how this changes through the day to avoid peak pricing.

  • Smart meter integration

    Track your consumption and spend.
    Seamlessly connect to your smart meter to track live household power usage and monitor your exact daily spend as it happens.

  • Historical energy data

    Spot trends and optimise your usage.
    Review past usage to see trends, uncover power drainage issues and spot seasonal patterns to reduce your overall bills.

  • Notifications

    Timely alerts for price spikes and drops.
    Get alerted when energy rates go up or low-cost windows open, helping you adapt your household power usage and save money.

  • Carbon intensity

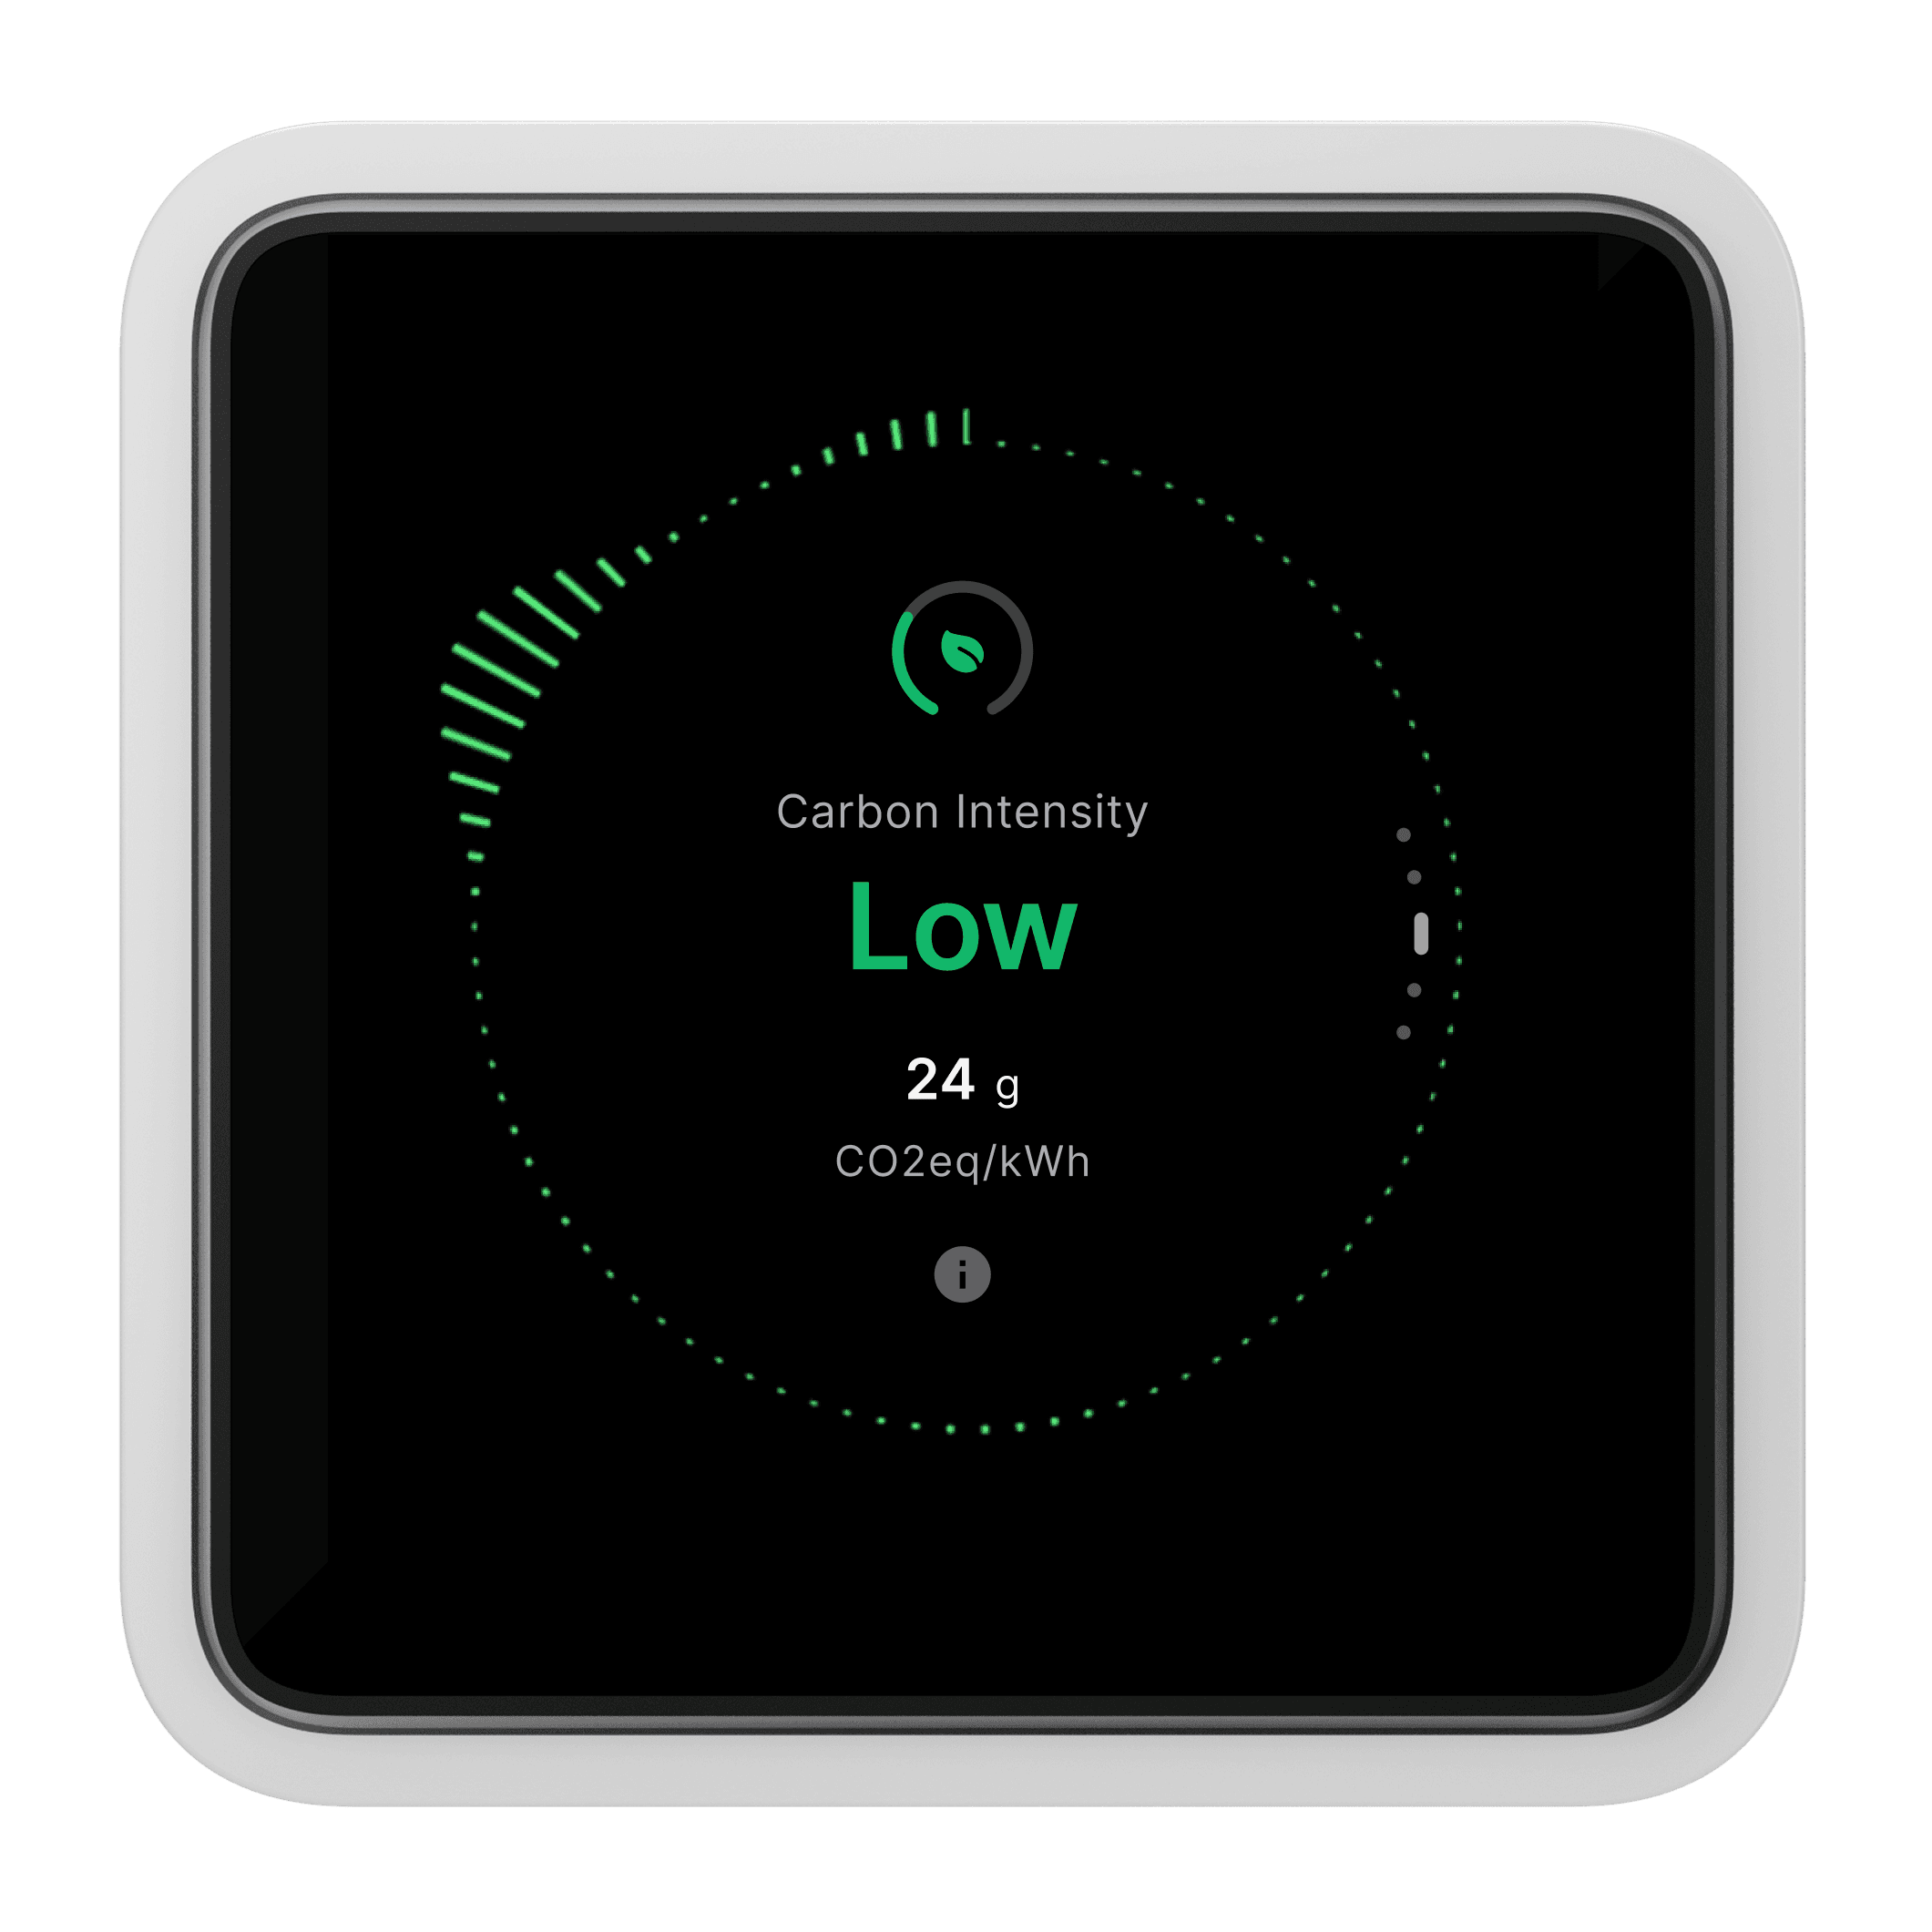
    Power your home with cleaner energy.
    Monitor UK grid data to see when wind and solar are generating power, allowing you to shift usage to green energy times.

  • Flexible tariff simulator

    Model potential savings before you switch. Analyse your real consumption against variable market rates to calculate how much you could save on a dynamic, time-of-use tariff.

Smart meter integration

Track your consumption and spend.
Seamlessly connect to your smart meter to track live household power usage and monitor your exact daily spend as it happens.

Energy tariff data

Your electricity costs, at a glance.
View your live energy rate directly on Tap’s clock and understand how this changes through the day to avoid peak pricing.

Notifications

Timely alerts for price spikes and drops.
Get alerted when energy rates go up or low-cost windows open, helping you adapt your household power usage and save money.

Flexible tariff simulator

Model potential savings before you switch. Analyse your real consumption against variable market rates to calculate how much you could save on a dynamic,
time-of-use tariff.

Historical energy data

Spot trends and optimise your usage.
Review past usage to see trends, uncover power drainage issues and spot seasonal patterns to reduce your overall bills.

Carbon intensity

Power your home with cleaner energy.
Monitor UK grid data to see when wind and solar are generating power, allowing you to shift usage to green energy times.

Energy everyone understands.

Not all energy usage can be moved, but some of your biggest consumers of power often can. Take a look below for examples of shiftable energy usage you can use at different times of day in order to run your home for less during off-peak hours.

Charge the EV

Do the washing

Heat the water tank

Run the dishwasher

Energy changes every day

Traditional tariffs charge a flat rate, but modern dynamic tariffs change every half hour. Sometimes green electricity becomes incredibly cheap, or even completely free. On rare occasions, the grid will actually pay you to use power. Without the right visibility, you’d never know when to take advantage. Tewke makes sure you always do.

Is your tariff right for you?

Not sure whether a time-of-day tariff is right for you? Tewke compares how your home actually uses electricity with alternative tariffs. See what yesterday would have cost. See what last month would have cost. Switch with confidence, not guesswork.

Energy is just the beginning.

Most energy tools are hidden away in a smartphone app for a single user, but Tewke is designed for the whole household. Bringing live energy insights directly to the wall, clearly displayed, so that everyone in the family can make smarter choices together. After all, the smartest home isn't the one with the most complex data, it’s the one that uses its information best.

Frequently asked questions.

What is smart home energy monitoring?

Smart home energy monitoring uses connected technology to track how a home is using electricity, often down to individual circuits or appliances rather than just the total. Tap’s energy management feature helps homeowners understand consumption patterns, spot inefficiencies and make more informed decisions about how they use energy.

What's the difference between a smart meter and smart energy monitoring?

A smart meter measures total household electricity use and reports it to your energy supplier. Tap’s smart energy monitoring goes much further, breaking usage down by circuit or appliance, tracking live cost and comparing that data with your tariff, providing you with insight a standard smart meter on its own doesn't.

Can smart energy monitoring help reduce energy bills?

Yes. By showing which devices and rooms use the most electricity, and when, Tap’s smart energy monitoring makes it easier to identify wasteful habits, shift usage of the biggest consumers of electricity to cheaper times and check whether your current tariff is still the best fit for your home.

Can smart energy monitoring track individual appliances, not just the whole house?

Yes. Tap breaks down energy use by circuit, so you can see which specific appliances or rooms are driving consumption, rather than only viewing one combined household total, as you’d get from your standard smart meter.

Can smart energy tools help me choose the right electricity tariff?

Yes. Tap's Agile Tariff Simulator compares how your home actually uses electricity against alternative tariffs, showing what past usage would have cost under a different plan, helping you decide whether to switch based on real data rather than guesswork.

What is 'carbon intensity' and why does it matter for my energy use?

'Carbon intensity' is a measure of how much CO₂ is produced by the generation sources for the electricity you use. This changes throughout the day as the UK grid draws more or less power from wind, solar and other renewables versus gas fuelled power stations. Tap's carbon intensity feature shows you this in real time, so you can choose to run heavy energy appliances when the grid is at its cleanest.

Can Tap alert me when electricity prices change?

Yes. Notifications on the Tap screen and in Tewke app let you know the moment rates spike or a low-cost, off-peak window opens, so you can shift usage to the cheapest times without having to constantly check a dashboard.

  • Energy tariff data

    Your electricity costs, at a glance.
    View your live energy rate directly on Tap’s clock and understand how this changes through the day to avoid peak pricing.

  • Smart meter integration

    Track your consumption and spend.
    Seamlessly connect to your smart meter to track live household power usage and monitor your exact daily spend as it happens.

  • Historical energy data

    Spot trends and optimise your usage.
    Review past usage to see trends, uncover power drainage issues and spot seasonal patterns to reduce your overall bills.

  • Notifications

    Timely alerts for price spikes and drops.
    Get alerted when energy rates go up or low-cost windows open, helping you adapt your household power usage and save money.

  • Carbon intensity

    Power your home with cleaner energy.
    Monitor UK grid data to see when wind and solar are generating power, allowing you to shift usage to green energy times.

  • Flexible tariff simulator

    Model potential savings before you switch. Analyse your real consumption against variable market rates to calculate how much you could save on a dynamic, time-of-use tariff.

Smart meter integration

Track your consumption and spend.
Seamlessly connect to your smart meter to track live household power usage and monitor your exact daily spend as it happens.

Energy tariff data

Your electricity costs, at a glance.
View your live energy rate directly on Tap’s clock and understand how this changes through the day to avoid peak pricing.

Notifications

Timely alerts for price spikes and drops.
Get alerted when energy rates go up or low-cost windows open, helping you adapt your household power usage and save money.

Flexible tariff simulator

Model potential savings before you switch. Analyse your real consumption against variable market rates to calculate how much you could save on a dynamic,
time-of-use tariff.

Historical energy data

Spot trends and optimise your usage.
Review past usage to see trends, uncover power drainage issues and spot seasonal patterns to reduce your overall bills.

Carbon intensity

Power your home with cleaner energy.
Monitor UK grid data to see when wind and solar are generating power, allowing you to shift usage to green energy times.

Energy everyone understands.

Not all energy usage can be moved, but some of your biggest consumers of power often can. Take a look below for examples of shiftable energy usage you can use at different times of day in order to run your home for less during off-peak hours.

Charge the EV

Do the washing

Heat the water tank

Run the dishwasher

Energy changes every day

Traditional tariffs charge a flat rate, but modern dynamic tariffs change every half hour. Sometimes green electricity becomes incredibly cheap, or even completely free. On rare occasions, the grid will actually pay you to use power. Without the right visibility, you’d never know when to take advantage. Tewke makes sure you always do.

Is your tariff right for you?

Not sure whether a time-of-day tariff is right for you? Tewke compares how your home actually uses electricity with alternative tariffs. See what yesterday would have cost. See what last month would have cost. Switch with confidence, not guesswork.

Energy is just the beginning.

Most energy tools are hidden away in a smartphone app for a single user, but Tewke is designed for the whole household. Bringing live energy insights directly to the wall, clearly displayed, so that everyone in the family can make smarter choices together. After all, the smartest home isn't the one with the most complex data, it’s the one that uses its information best.

Frequently asked questions.

What is smart home energy monitoring?

Smart home energy monitoring uses connected technology to track how a home is using electricity, often down to individual circuits or appliances rather than just the total. Tap’s energy management feature helps homeowners understand consumption patterns, spot inefficiencies and make more informed decisions about how they use energy.

What's the difference between a smart meter and smart energy monitoring?

A smart meter measures total household electricity use and reports it to your energy supplier. Tap’s smart energy monitoring goes much further, breaking usage down by circuit or appliance, tracking live cost and comparing that data with your tariff, providing you with insight a standard smart meter on its own doesn't.

Can smart energy monitoring help reduce energy bills?

Yes. By showing which devices and rooms use the most electricity, and when, Tap’s smart energy monitoring makes it easier to identify wasteful habits, shift usage of the biggest consumers of electricity to cheaper times and check whether your current tariff is still the best fit for your home.

Can smart energy monitoring track individual appliances, not just the whole house?

Yes. Tap breaks down energy use by circuit, so you can see which specific appliances or rooms are driving consumption, rather than only viewing one combined household total, as you’d get from your standard smart meter.

Can smart energy tools help me choose the right electricity tariff?

Yes. Tap's Agile Tariff Simulator compares how your home actually uses electricity against alternative tariffs, showing what past usage would have cost under a different plan, helping you decide whether to switch based on real data rather than guesswork.

What is 'carbon intensity' and why does it matter for my energy use?

'Carbon intensity' is a measure of how much CO₂ is produced by the generation sources for the electricity you use. This changes throughout the day as the UK grid draws more or less power from wind, solar and other renewables versus gas fuelled power stations. Tap's carbon intensity feature shows you this in real time, so you can choose to run heavy energy appliances when the grid is at its cleanest.

Can Tap alert me when electricity prices change?

Yes. Notifications on the Tap screen and in Tewke app let you know the moment rates spike or a low-cost, off-peak window opens, so you can shift usage to the cheapest times without having to constantly check a dashboard.

  • Energy tariff data

    Your electricity costs, at a glance.
    View your live energy rate directly on Tap’s clock and understand how this changes through the day to avoid peak pricing.

  • Smart meter integration

    Track your consumption and spend.
    Seamlessly connect to your smart meter to track live household power usage and monitor your exact daily spend as it happens.

  • Historical energy data

    Spot trends and optimise your usage.
    Review past usage to see trends, uncover power drainage issues and spot seasonal patterns to reduce your overall bills.

  • Notifications

    Timely alerts for price spikes and drops.
    Get alerted when energy rates go up or low-cost windows open, helping you adapt your household power usage and save money.

  • Carbon intensity

    Power your home with cleaner energy.
    Monitor UK grid data to see when wind and solar are generating power, allowing you to shift usage to green energy times.

  • Flexible tariff simulator

    Model potential savings before you switch. Analyse your real consumption against variable market rates to calculate how much you could save on a dynamic, time-of-use tariff.

Smart meter integration

Track your consumption and spend.
Seamlessly connect to your smart meter to track live household power usage and monitor your exact daily spend as it happens.

Energy tariff data

Your electricity costs, at a glance.
View your live energy rate directly on Tap’s clock and understand how this changes through the day to avoid peak pricing.

Notifications

Timely alerts for price spikes and drops.
Get alerted when energy rates go up or low-cost windows open, helping you adapt your household power usage and save money.

Flexible tariff simulator

Model potential savings before you switch. Analyse your real consumption against variable market rates to calculate how much you could save on a dynamic,
time-of-use tariff.

Historical energy data

Spot trends and optimise your usage.
Review past usage to see trends, uncover power drainage issues and spot seasonal patterns to reduce your overall bills.

Carbon intensity

Power your home with cleaner energy.
Monitor UK grid data to see when wind and solar are generating power, allowing you to shift usage to green energy times.

Energy everyone understands.

Not all energy usage can be moved, but some of your biggest consumers of power often can. Take a look below for examples of shiftable energy usage you can use at different times of day in order to run your home for less during off-peak hours.

Charge the EV

Do the washing

Heat the water tank

Run the dishwasher

Energy changes every day

Traditional tariffs charge a flat rate, but modern dynamic tariffs change every half hour. Sometimes green electricity becomes incredibly cheap, or even completely free. On rare occasions, the grid will actually pay you to use power. Without the right visibility, you’d never know when to take advantage. Tewke makes sure you always do.

Is your tariff right for you?

Not sure whether a time-of-day tariff is right for you? Tewke compares how your home actually uses electricity with alternative tariffs. See what yesterday would have cost. See what last month would have cost. Switch with confidence, not guesswork.

Energy is just the beginning.

Most energy tools are hidden away in a smartphone app for a single user, but Tewke is designed for the whole household. Bringing live energy insights directly to the wall, clearly displayed, so that everyone in the family can make smarter choices together. After all, the smartest home isn't the one with the most complex data, it’s the one that uses its information best.

Frequently asked questions.

What is smart home energy monitoring?

Smart home energy monitoring uses connected technology to track how a home is using electricity, often down to individual circuits or appliances rather than just the total. Tap’s energy management feature helps homeowners understand consumption patterns, spot inefficiencies and make more informed decisions about how they use energy.

What's the difference between a smart meter and smart energy monitoring?

A smart meter measures total household electricity use and reports it to your energy supplier. Tap’s smart energy monitoring goes much further, breaking usage down by circuit or appliance, tracking live cost and comparing that data with your tariff, providing you with insight a standard smart meter on its own doesn't.

Can smart energy monitoring help reduce energy bills?

Yes. By showing which devices and rooms use the most electricity, and when, Tap’s smart energy monitoring makes it easier to identify wasteful habits, shift usage of the biggest consumers of electricity to cheaper times and check whether your current tariff is still the best fit for your home.

Can smart energy monitoring track individual appliances, not just the whole house?

Yes. Tap breaks down energy use by circuit, so you can see which specific appliances or rooms are driving consumption, rather than only viewing one combined household total, as you’d get from your standard smart meter.

Can smart energy tools help me choose the right electricity tariff?

Yes. Tap's Agile Tariff Simulator compares how your home actually uses electricity against alternative tariffs, showing what past usage would have cost under a different plan, helping you decide whether to switch based on real data rather than guesswork.

What is 'carbon intensity' and why does it matter for my energy use?

'Carbon intensity' is a measure of how much CO₂ is produced by the generation sources for the electricity you use. This changes throughout the day as the UK grid draws more or less power from wind, solar and other renewables versus gas fuelled power stations. Tap's carbon intensity feature shows you this in real time, so you can choose to run heavy energy appliances when the grid is at its cleanest.

Can Tap alert me when electricity prices change?

Yes. Notifications on the Tap screen and in Tewke app let you know the moment rates spike or a low-cost, off-peak window opens, so you can shift usage to the cheapest times without having to constantly check a dashboard.

  • Energy tariff data

    Your electricity costs, at a glance.
    View your live energy rate directly on Tap’s clock and understand how this changes through the day to avoid peak pricing.

  • Smart meter integration

    Track your consumption and spend.
    Seamlessly connect to your smart meter to track live household power usage and monitor your exact daily spend as it happens.

  • Historical energy data

    Spot trends and optimise your usage.
    Review past usage to see trends, uncover power drainage issues and spot seasonal patterns to reduce your overall bills.

  • Notifications

    Timely alerts for price spikes and drops.
    Get alerted when energy rates go up or low-cost windows open, helping you adapt your household power usage and save money.

  • Carbon intensity

    Power your home with cleaner energy.
    Monitor UK grid data to see when wind and solar are generating power, allowing you to shift usage to green energy times.

  • Flexible tariff simulator

    Model potential savings before you switch. Analyse your real consumption against variable market rates to calculate how much you could save on a dynamic, time-of-use tariff.

Smart meter integration

Track your consumption and spend.
Seamlessly connect to your smart meter to track live household power usage and monitor your exact daily spend as it happens.

Energy tariff data

Your electricity costs, at a glance.
View your live energy rate directly on Tap’s clock and understand how this changes through the day to avoid peak pricing.

Notifications

Timely alerts for price spikes and drops.
Get alerted when energy rates go up or low-cost windows open, helping you adapt your household power usage and save money.

Flexible tariff simulator

Model potential savings before you switch. Analyse your real consumption against variable market rates to calculate how much you could save on a dynamic,
time-of-use tariff.

Historical energy data

Spot trends and optimise your usage.
Review past usage to see trends, uncover power drainage issues and spot seasonal patterns to reduce your overall bills.

Carbon intensity

Power your home with cleaner energy.
Monitor UK grid data to see when wind and solar are generating power, allowing you to shift usage to green energy times.

Energy everyone understands.

Not all energy usage can be moved, but some of your biggest consumers of power often can. Take a look below for examples of shiftable energy usage you can use at different times of day in order to run your home for less during off-peak hours.

Charge the EV

Do the washing

Heat the water tank

Run the dishwasher

Energy changes every day

Traditional tariffs charge a flat rate, but modern dynamic tariffs change every half hour. Sometimes green electricity becomes incredibly cheap, or even completely free. On rare occasions, the grid will actually pay you to use power. Without the right visibility, you’d never know when to take advantage. Tewke makes sure you always do.

Is your tariff right for you?

Not sure whether a time-of-day tariff is right for you? Tewke compares how your home actually uses electricity with alternative tariffs. See what yesterday would have cost. See what last month would have cost. Switch with confidence, not guesswork.


Energy is just the beginning.

Most energy tools are hidden away in a smartphone app for a single user, but Tewke is designed for the whole household. Bringing live energy insights directly to the wall, clearly displayed, so that everyone in the family can make smarter choices together. After all, the smartest home isn't the one with the most complex data, it’s the one that uses its information best.

Frequently asked questions.

What is smart home energy monitoring?

Smart home energy monitoring uses connected technology to track how a home is using electricity, often down to individual circuits or appliances rather than just the total. Tap’s energy management feature helps homeowners understand consumption patterns, spot inefficiencies and make more informed decisions about how they use energy.

What's the difference between a smart meter and smart energy monitoring?

A smart meter measures total household electricity use and reports it to your energy supplier. Tap’s smart energy monitoring goes much further, breaking usage down by circuit or appliance, tracking live cost and comparing that data with your tariff, providing you with insight a standard smart meter on its own doesn't.

Can smart energy monitoring help reduce energy bills?

Yes. By showing which devices and rooms use the most electricity, and when, Tap’s smart energy monitoring makes it easier to identify wasteful habits, shift usage of the biggest consumers of electricity to cheaper times and check whether your current tariff is still the best fit for your home.

Can smart energy monitoring track individual appliances, not just the whole house?

Yes. Tap breaks down energy use by circuit, so you can see which specific appliances or rooms are driving consumption, rather than only viewing one combined household total, as you’d get from your standard smart meter.

Can smart energy tools help me choose the right electricity tariff?

Yes. Tap's Agile Tariff Simulator compares how your home actually uses electricity against alternative tariffs, showing what past usage would have cost under a different plan, helping you decide whether to switch based on real data rather than guesswork.

What is 'carbon intensity' and why does it matter for my energy use?

'Carbon intensity' is a measure of how much CO₂ is produced by the generation sources for the electricity you use. This changes throughout the day as the UK grid draws more or less power from wind, solar and other renewables versus gas fuelled power stations. Tap's carbon intensity feature shows you this in real time, so you can choose to run heavy energy appliances when the grid is at its cleanest.

Can Tap alert me when electricity prices change?

Yes. Notifications on the Tap screen and in Tewke app let you know the moment rates spike or a low-cost, off-peak window opens, so you can shift usage to the cheapest times without having to constantly check a dashboard.